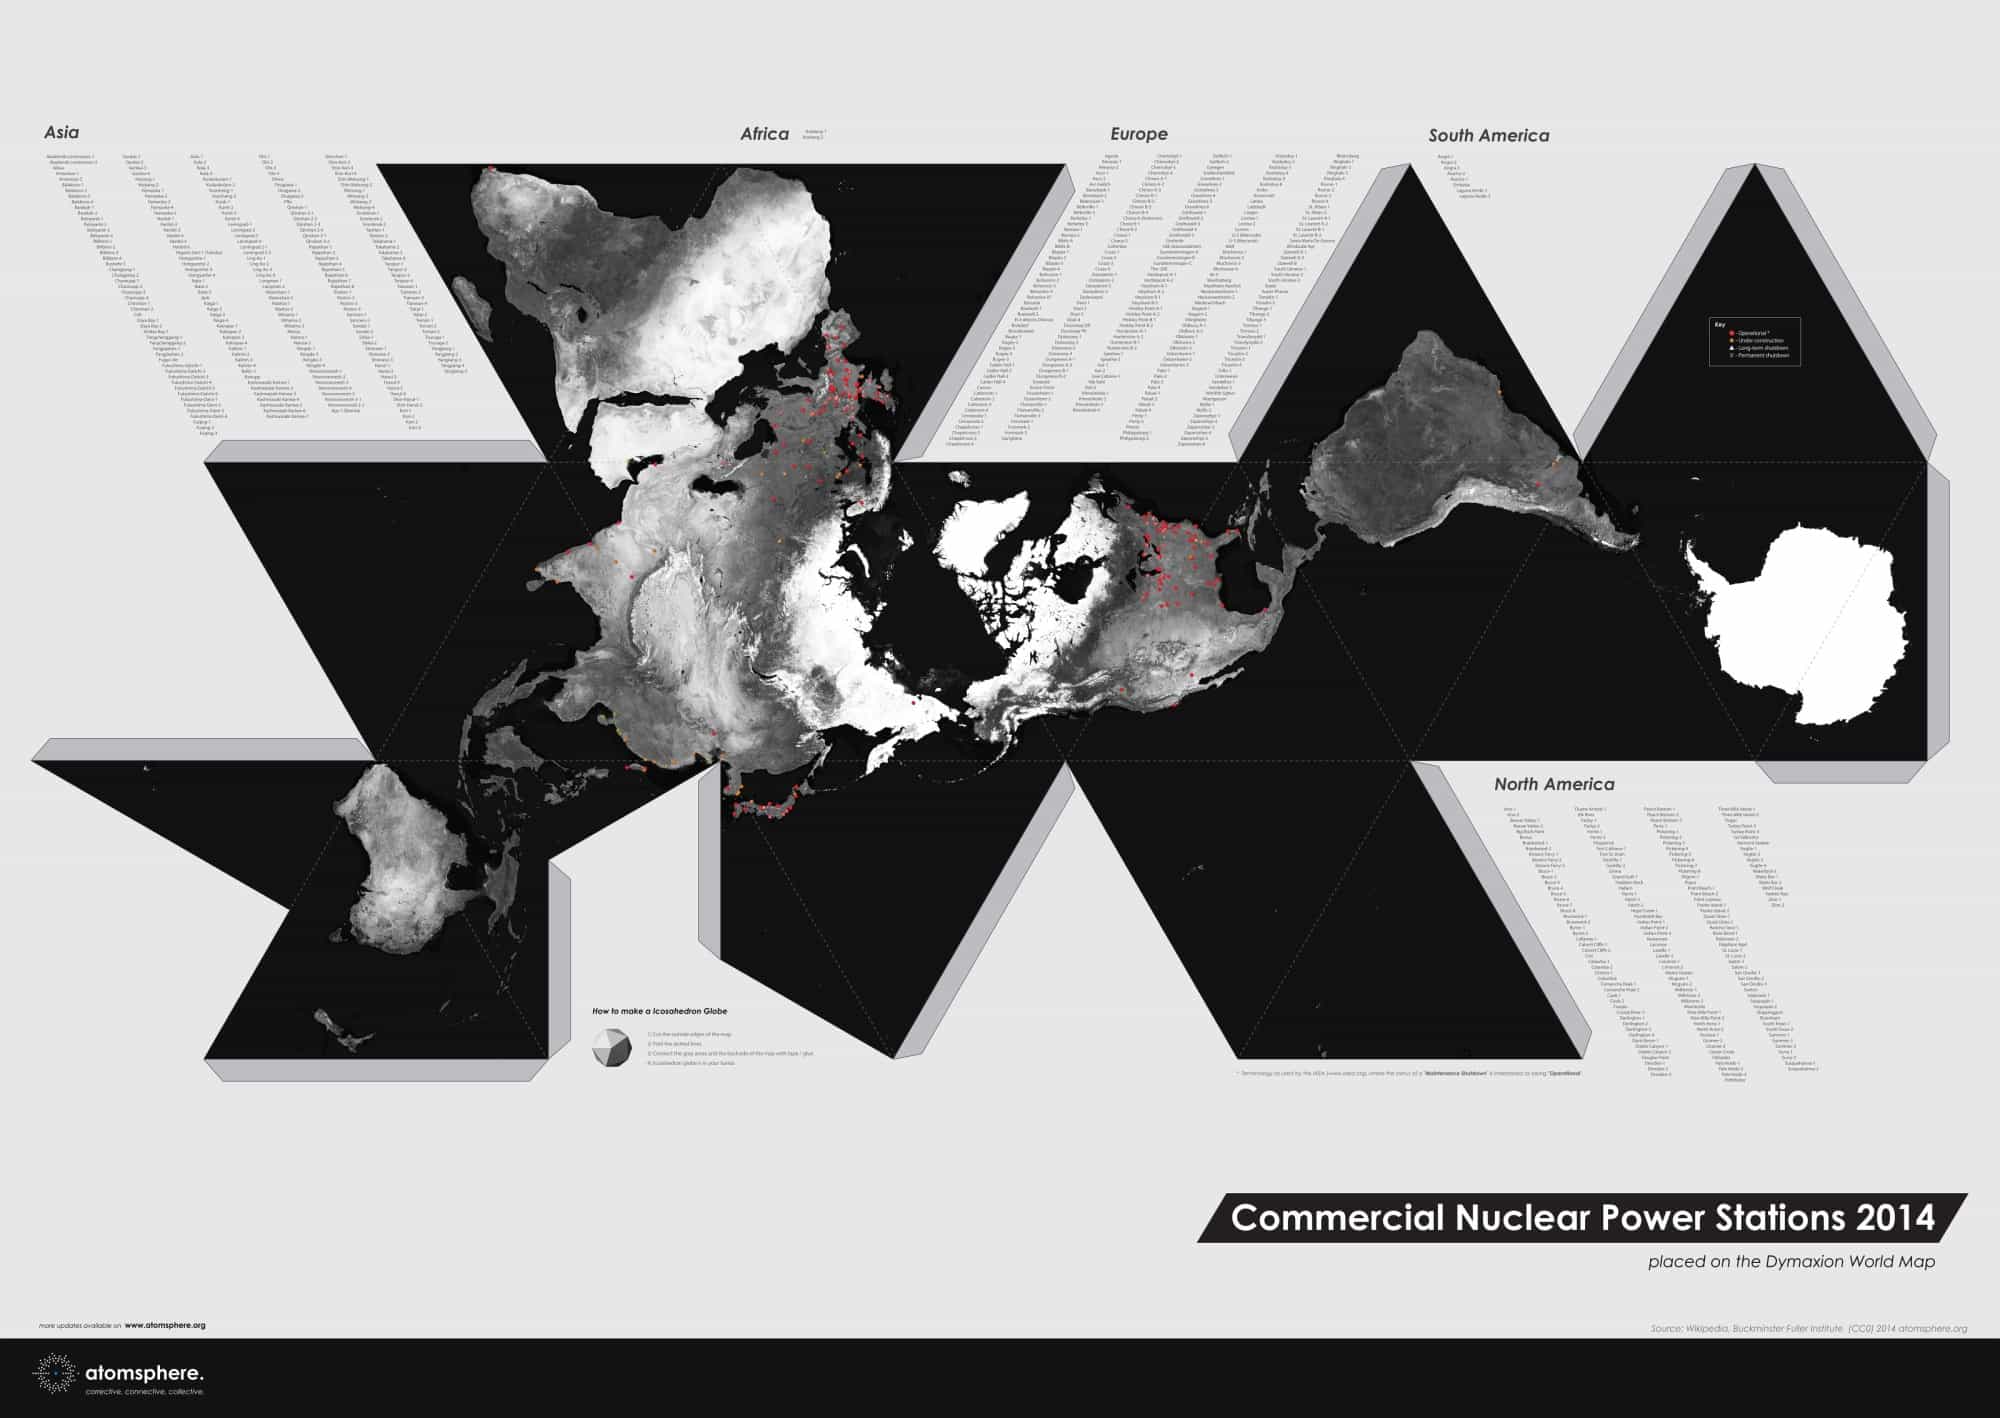
Data visualization of commercial nuclear power plants located on our planet in the year 2014 A.D. Using Dymaxion World Map to visualize each reactor’s status categorized as : ‘operational‘ , ‘under construction‘, ‘long term shutdown‘, ‘permanent shutdown‘. The aim for this map to bring up the awareness of our ‘system’ driven by consumption and social policy, resulting a one way technology without a break.
2014年の時点でこの地球上に存在する商用原子力発電所の可動状況を’稼働中’ , ‘建設中’ , ‘長期停止中’ , ‘廃炉’に分類したデータビジュアリゼーション。ダイマクション図法で描かれた地図を通じ人間の消費と政策が作り上げたシステムを俯瞰し、未来へリスクを押し付ける「ブレーキ無き技術」に対し警笛をならす。
Project by: Michael Saup & Acci Baba
see more on atomsphere.org
notes:
– Wikipedia list of nuclear power plants based on information supplied by the IAEA
– Buckminster Fuller Institute for the Dymaxion Map Projection developed by Buckminster Fuller
– Software tools developed by 1001 SUNS
Atomsphere
- project atomsphere
- year 2014
- role graphic design, data visualization
- output A0 Poster


