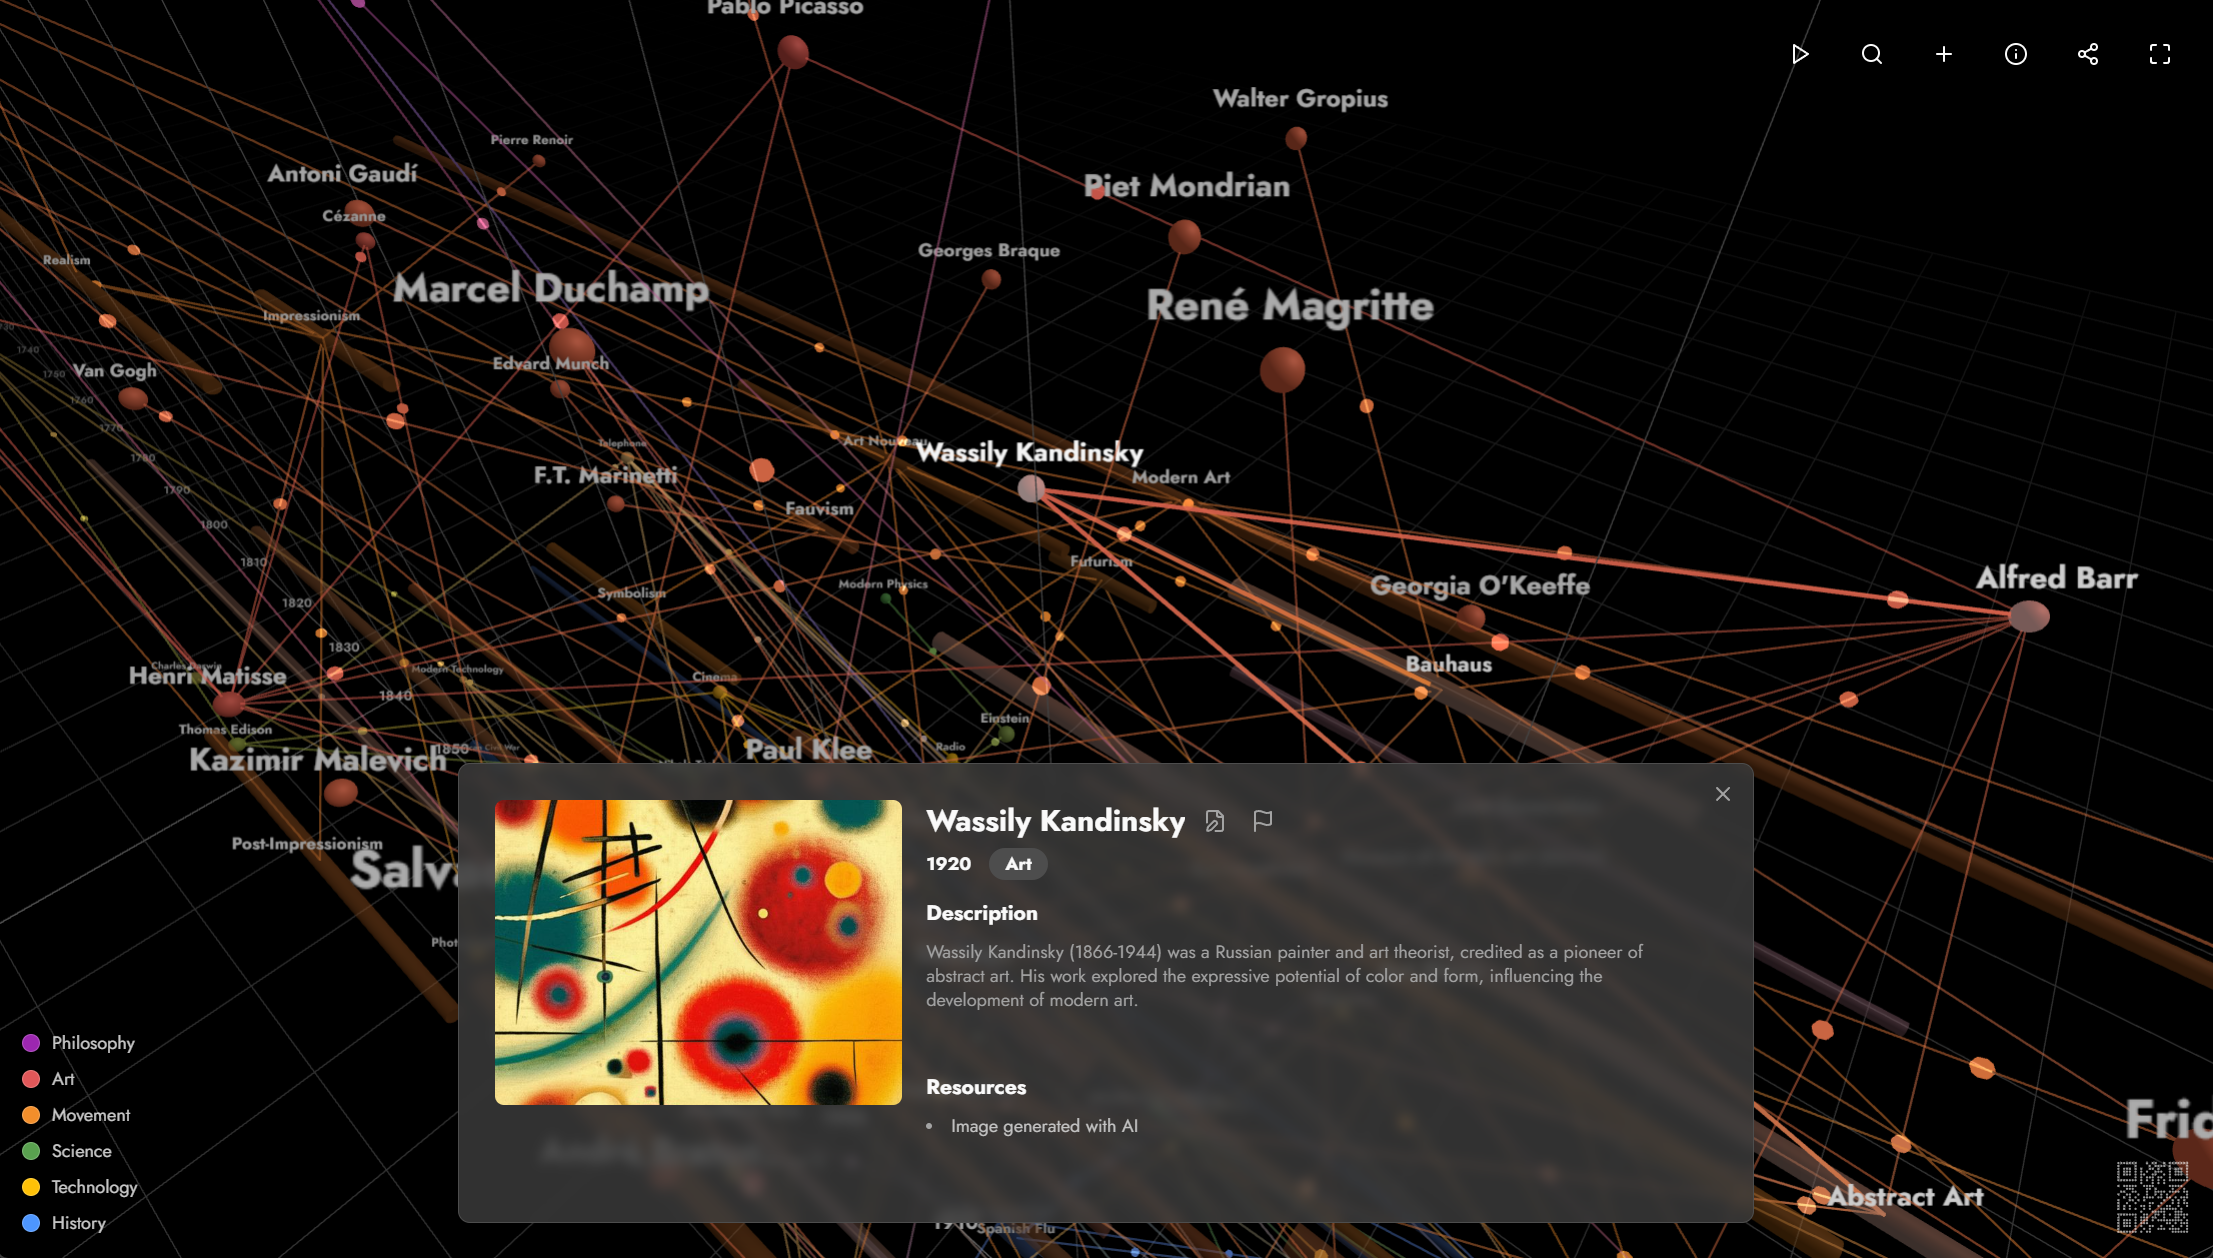
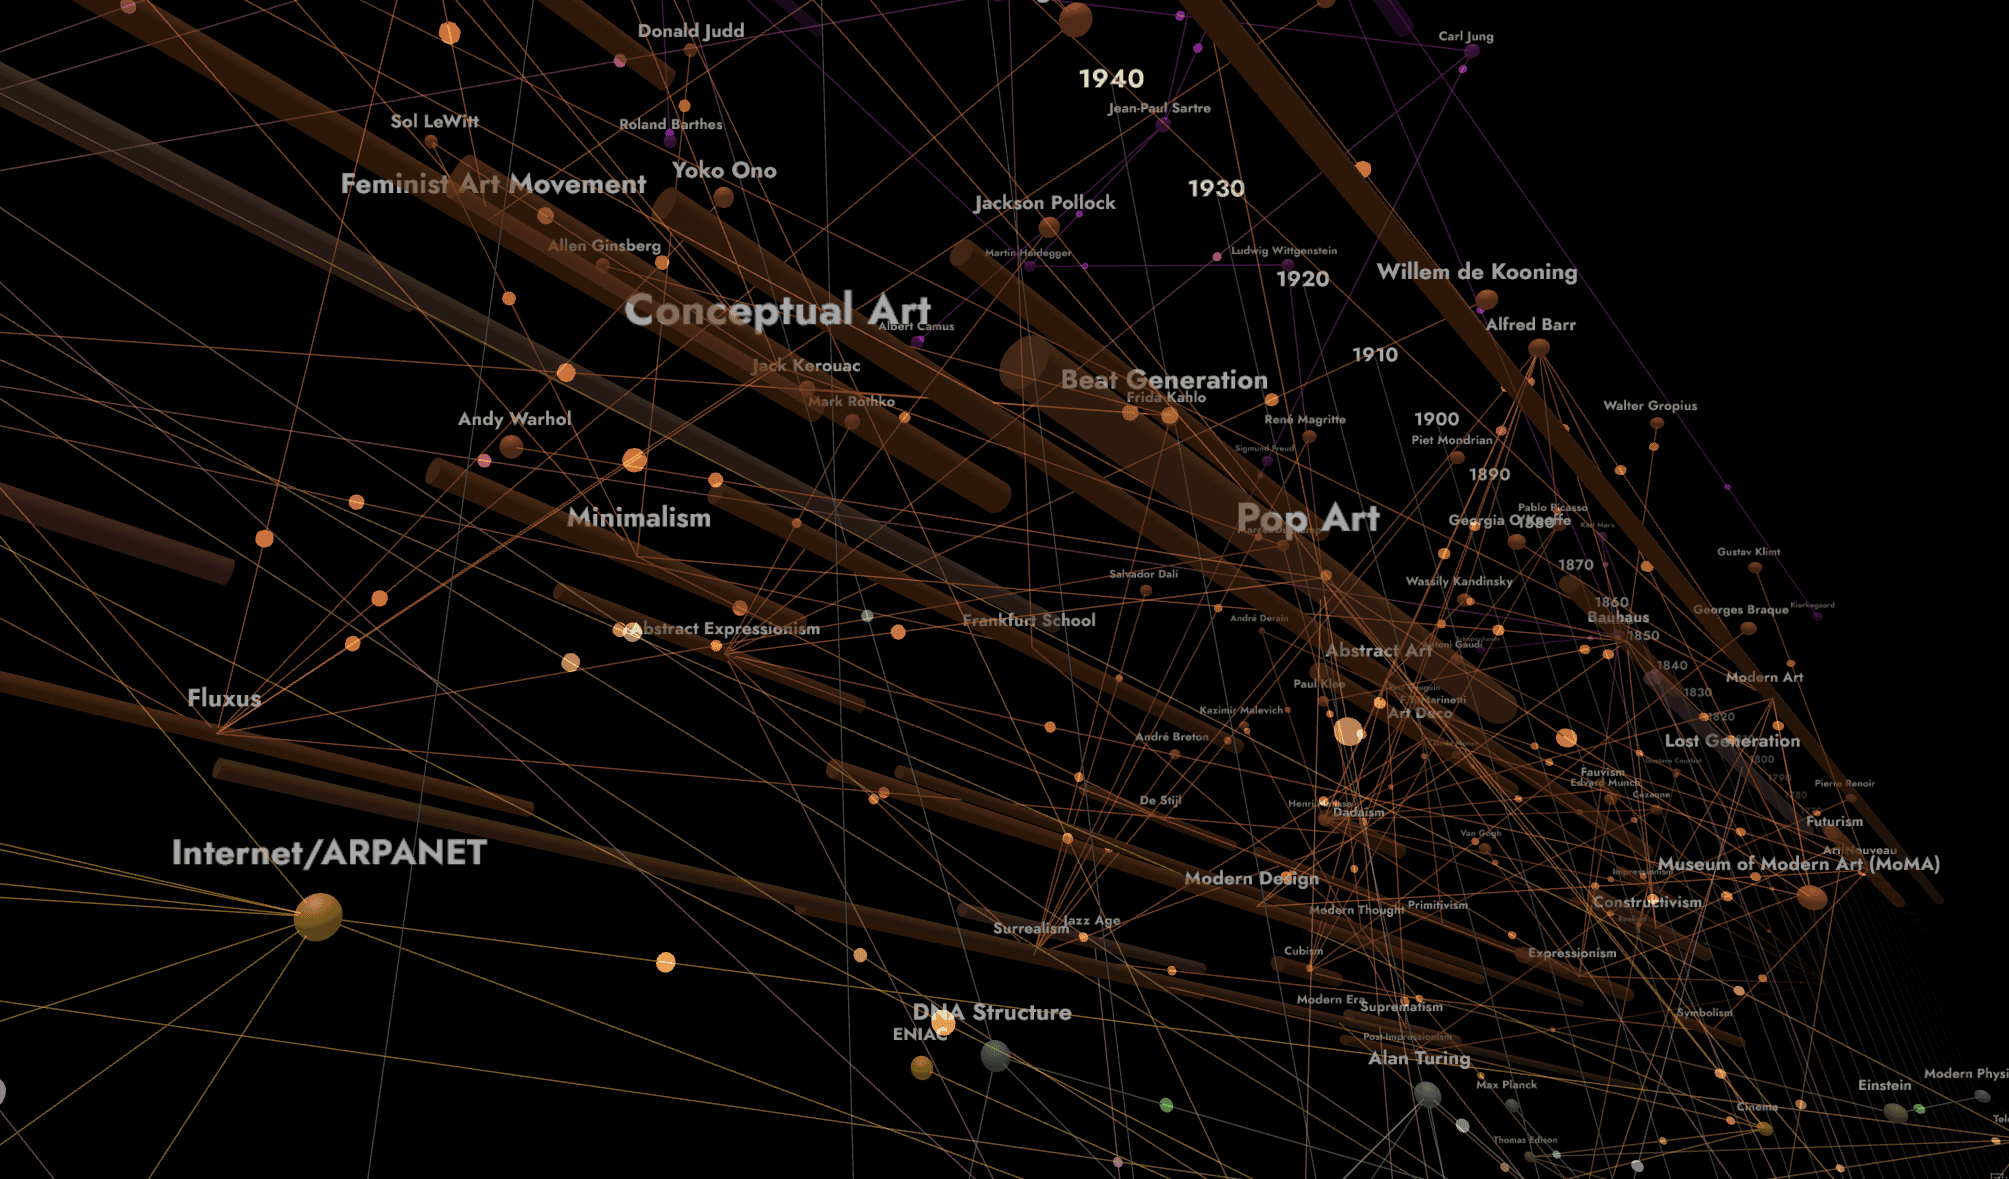
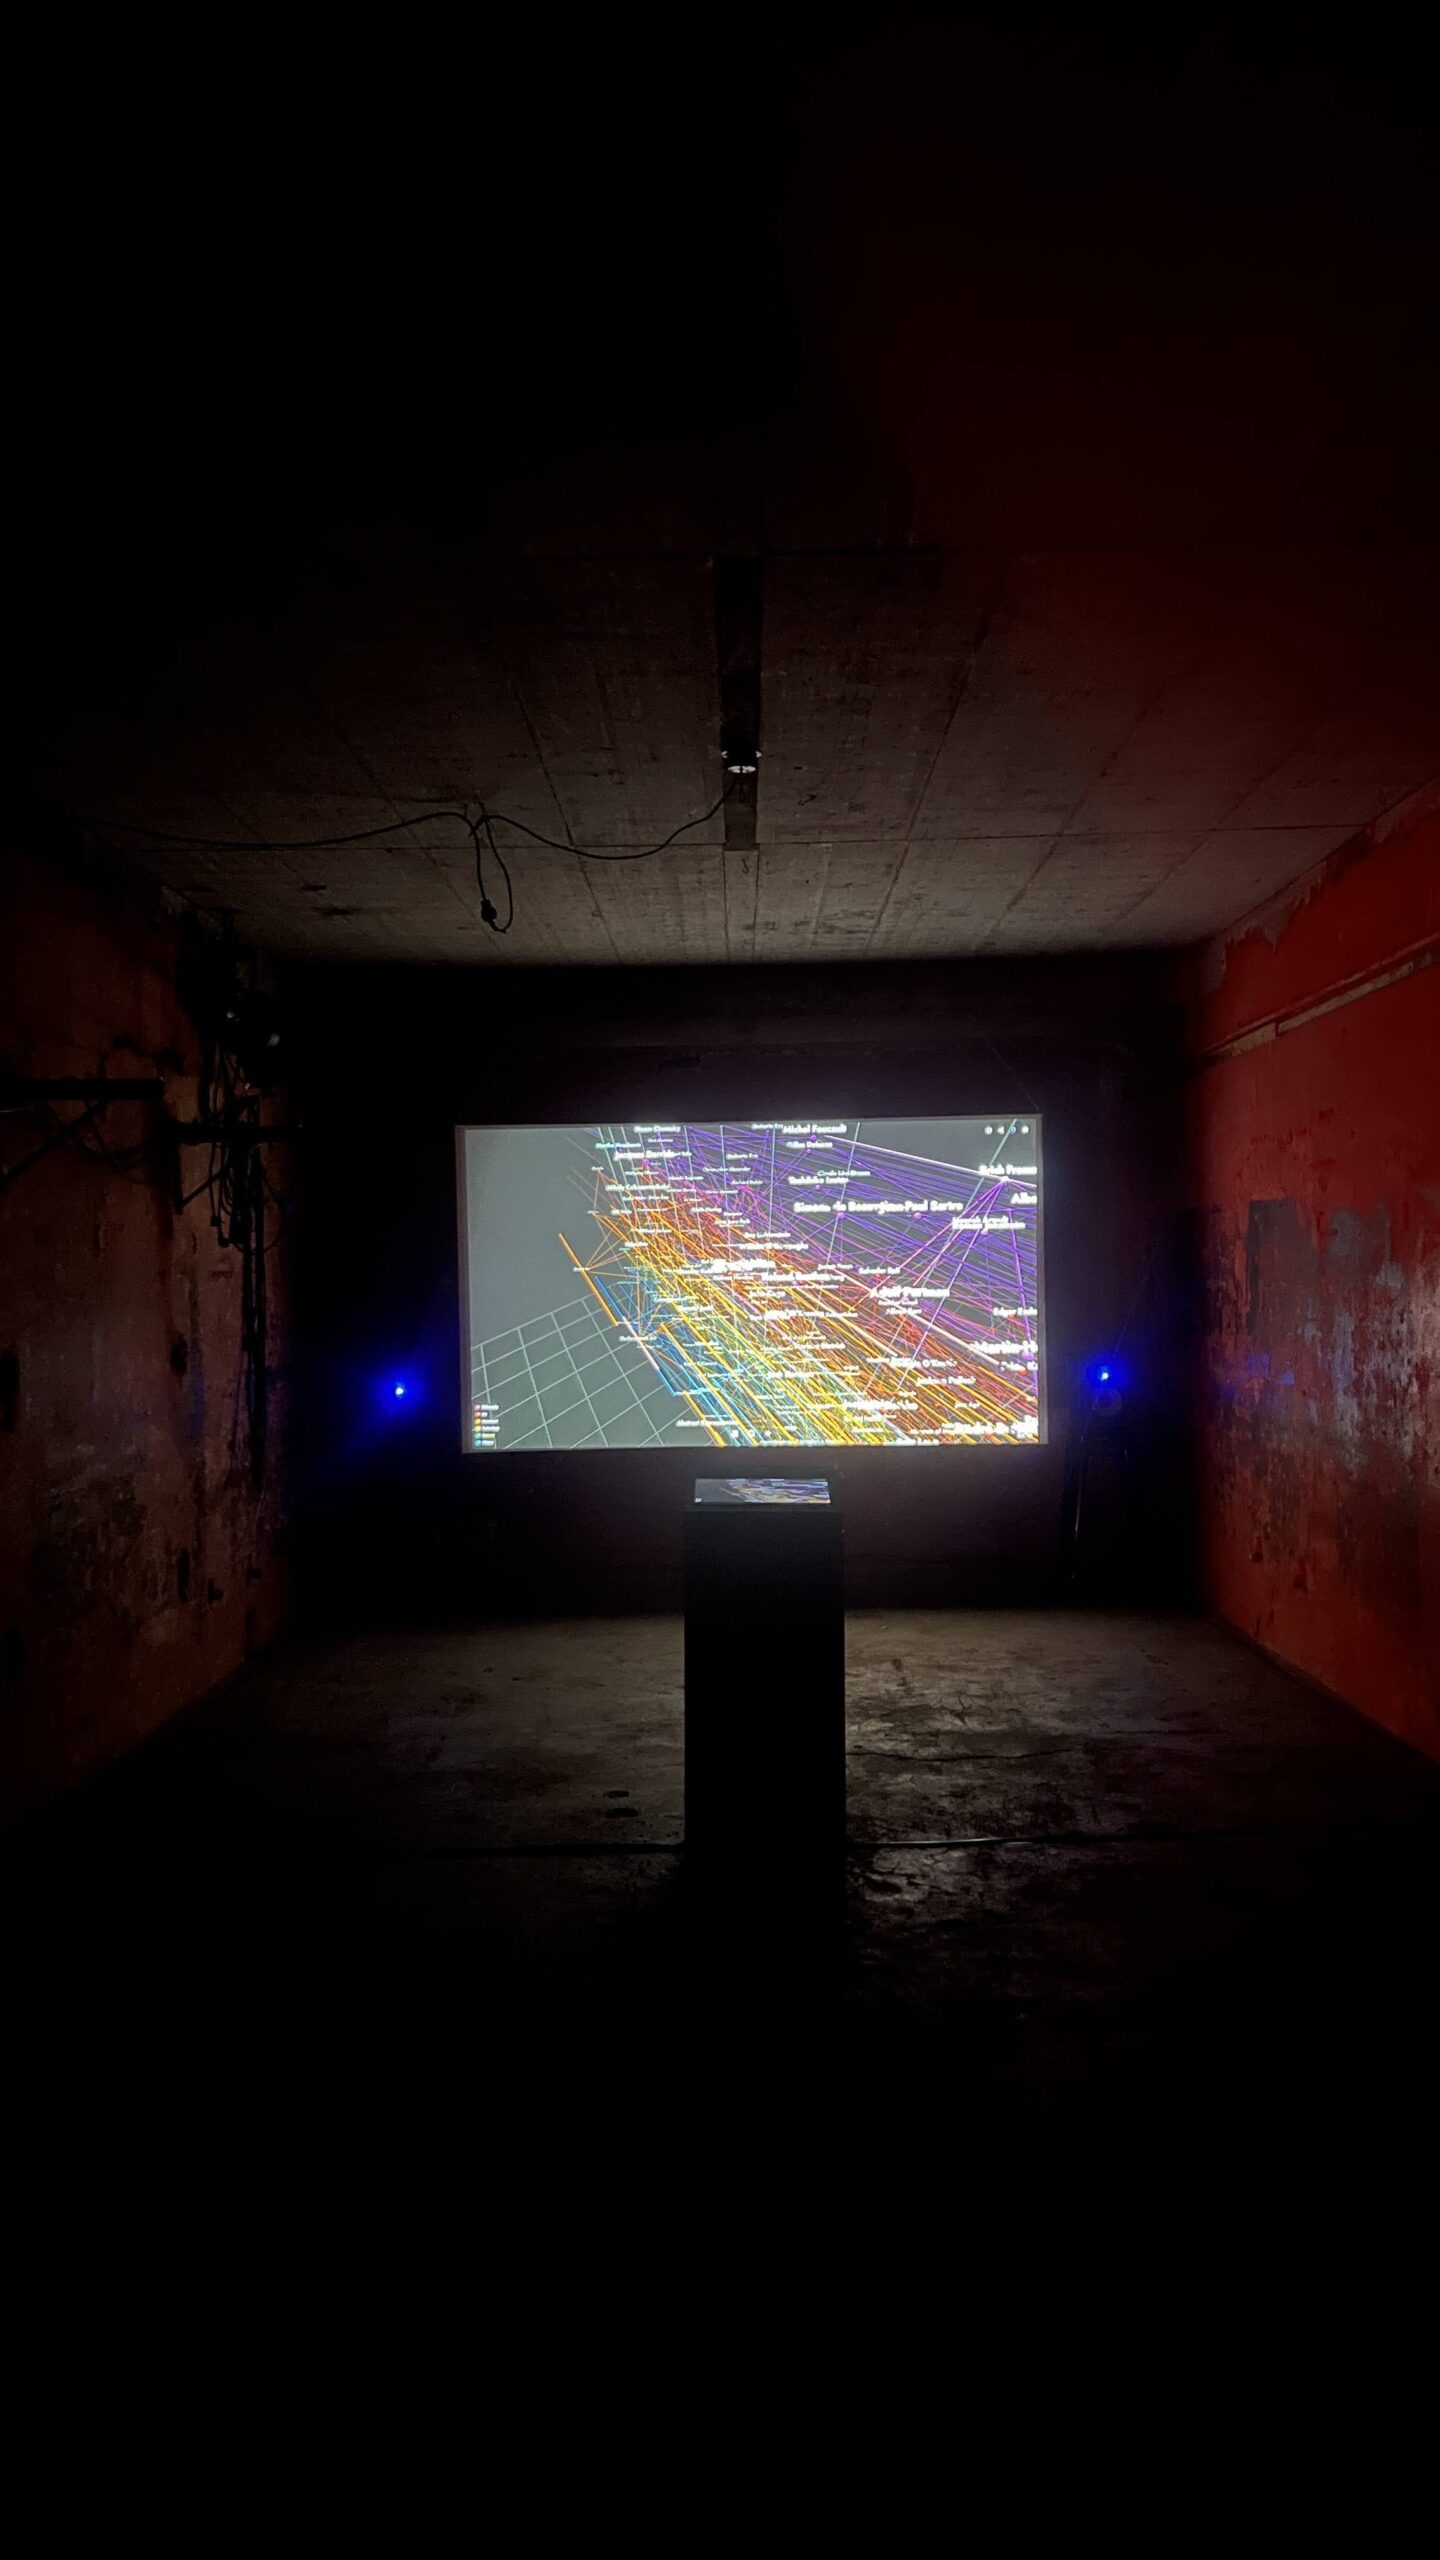
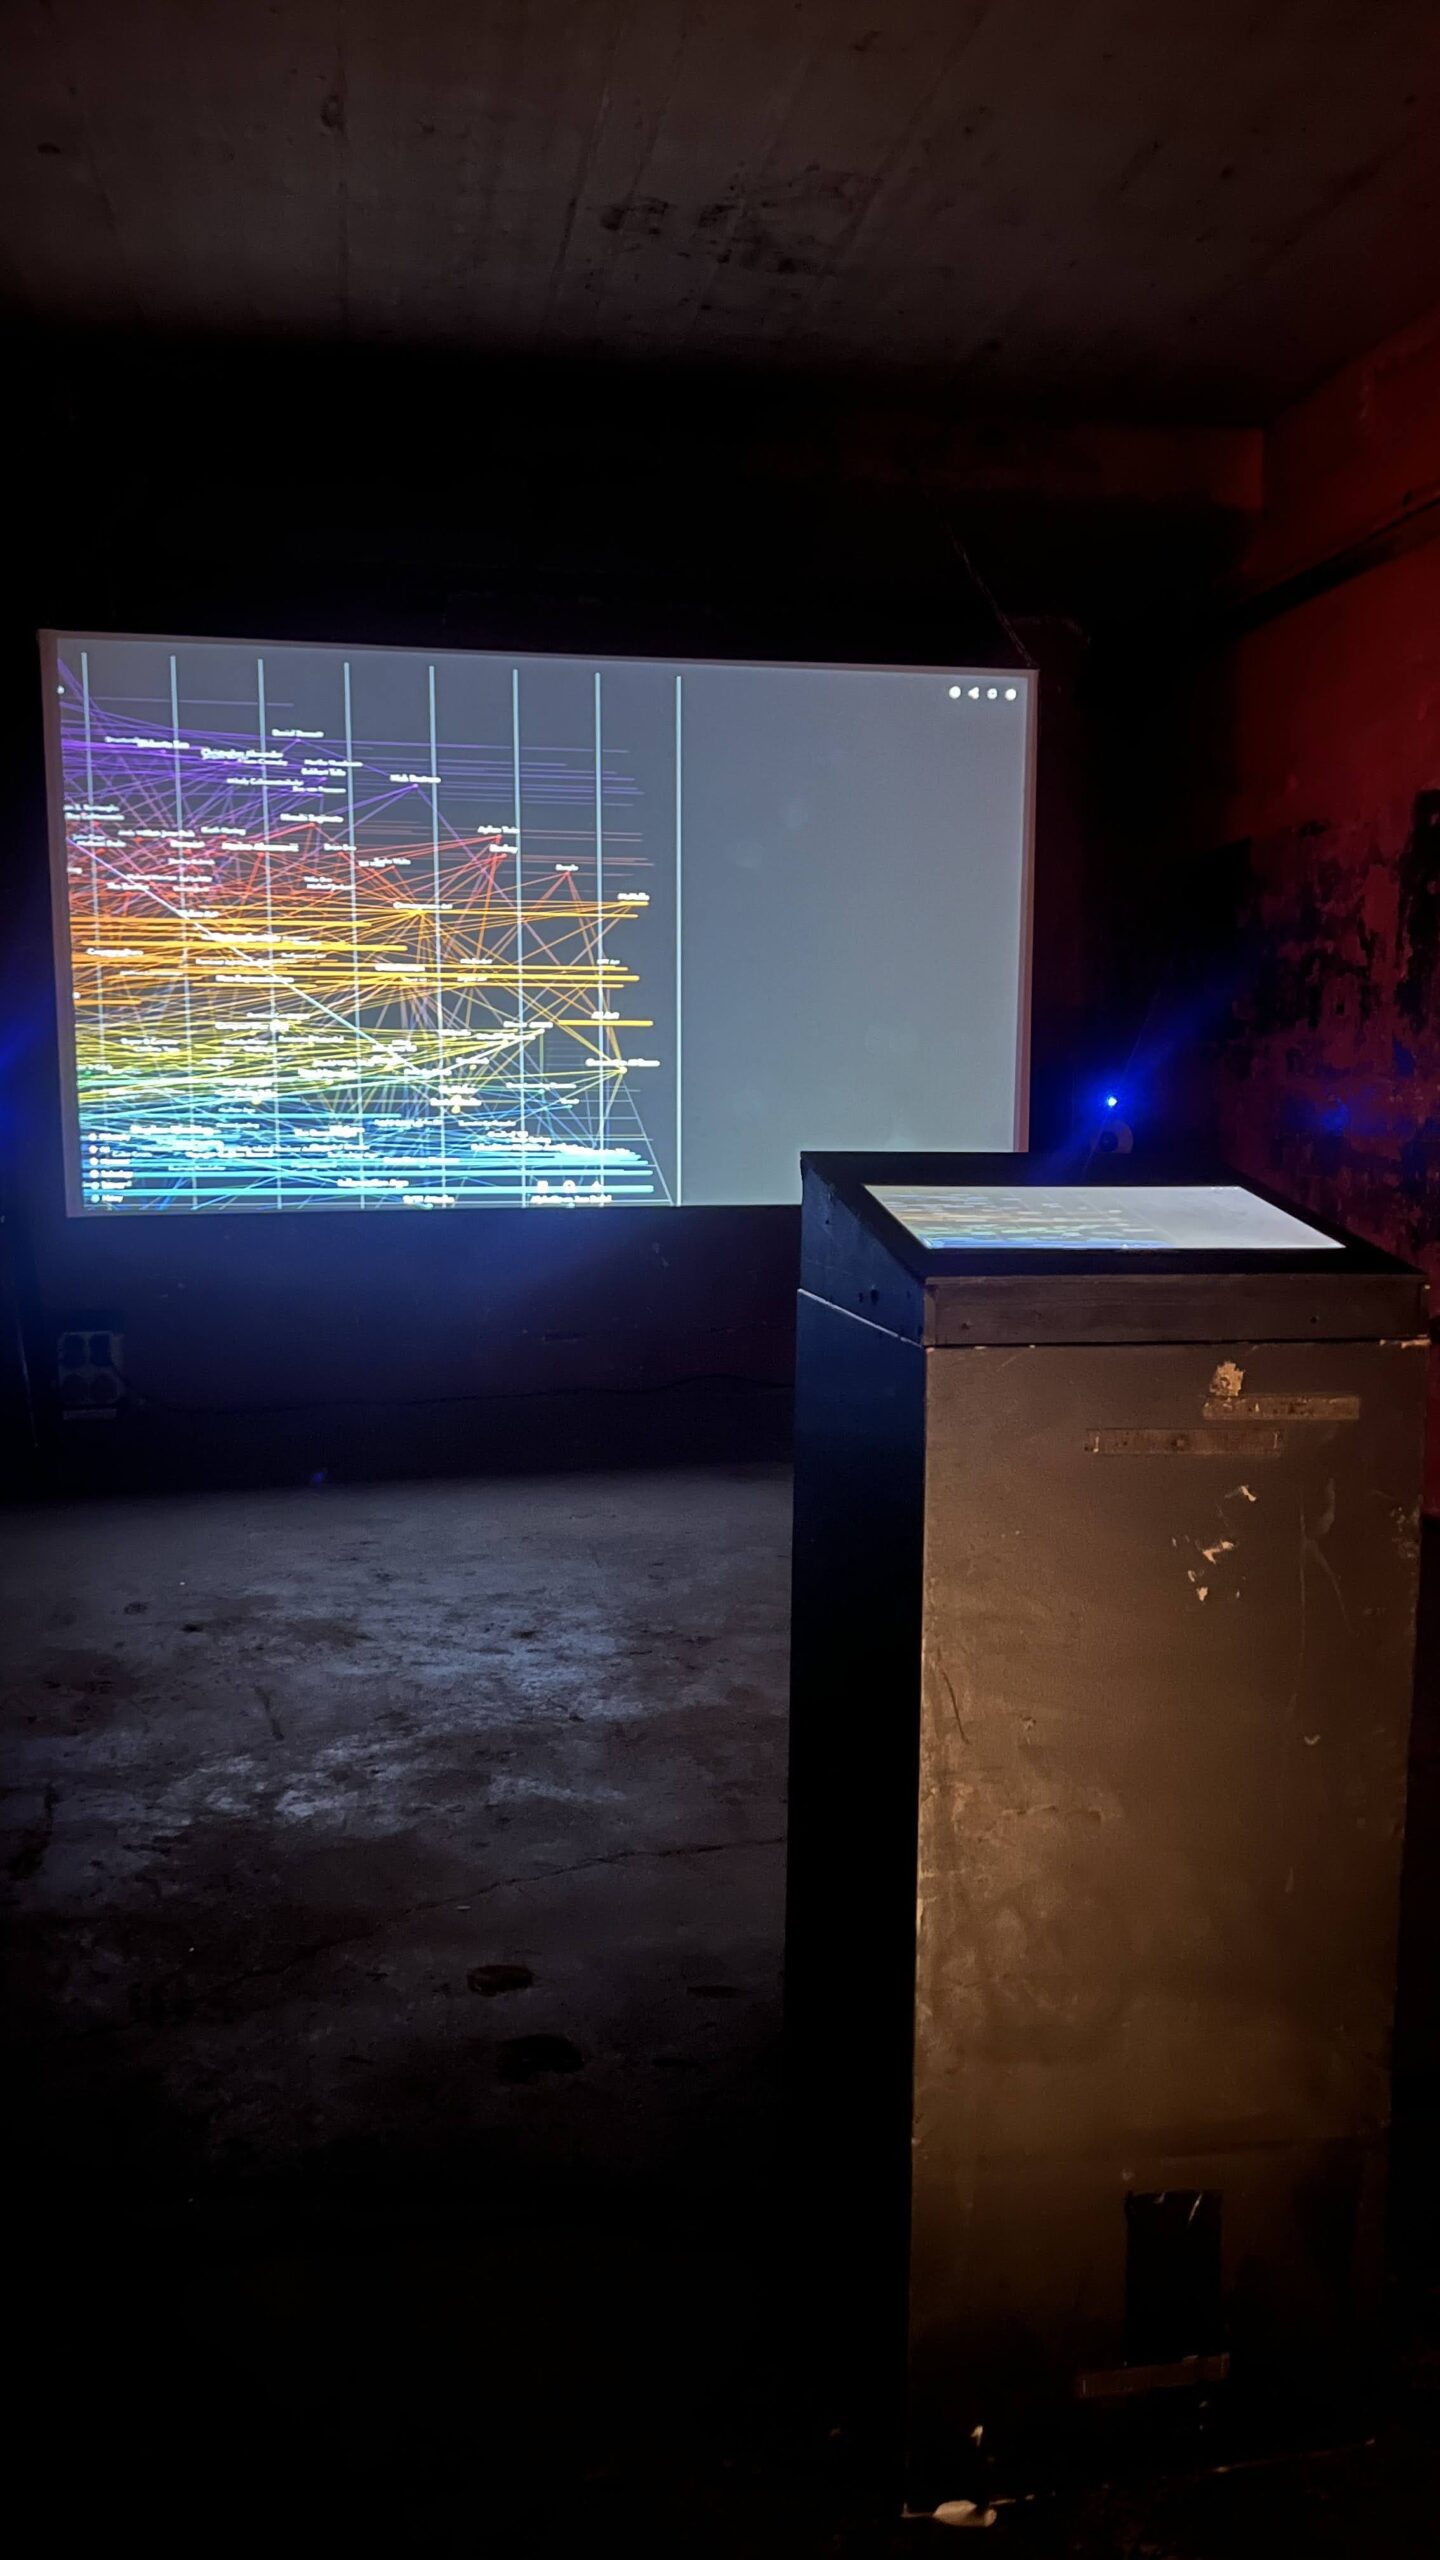
Baba’s Diagram is a living constellation of human knowledge that grows in digital space through collective contribution. This interactive visualization maps the relationships between Philosophy, Artists, Art Movements, Science, Technology, and Historical events—illuminating connections that linear narratives often obscure.
Beginning with a curated foundation of nodes, the constellation invites viewers to add new elements, modify links, and contribute missing connections, challenging linear approaches to intellectual history. Represented in a timeline grid, the work functions as a chronological sculpture of thought.
Built using open-source 3D Force-Directed Graph code, the visualization allows intuitive navigation. AI-assisted tools help users craft new nodes saved on a back-end database, making contribution accessible to all.
Inspired by Alfred Barr Jr.’s 1936 flowchart but re-imagined as an evolving ecosystem, the project preserves each contribution within its expanding architecture.
The work presents knowledge not as a fixed historical record but as an organic, growing entity—a collective cartography of human thought that honors our shared intellectual heritage.
BABA’S DIAGRAM / 2025
Acci Baba
Interactive Web Installation
Variable dimensions based on display (2k -16k)
—
LICENSING:
CC BY-NC-ND 4.0
Free for educational and personal research use.
Commercial license required for museums, exhibitions, and corporate use.
Contact: info@accibaba.com
Baba’s Diagram
- Concept, Coding, Design ACCI BABA
- Format Single-channel Interactive Web Installation
- Size Variable dimensions (2K-16K resolution)
- Year 2025
- Website diagram.accibaba.com